Report Design & Illustration
For an Australian Fintech Client
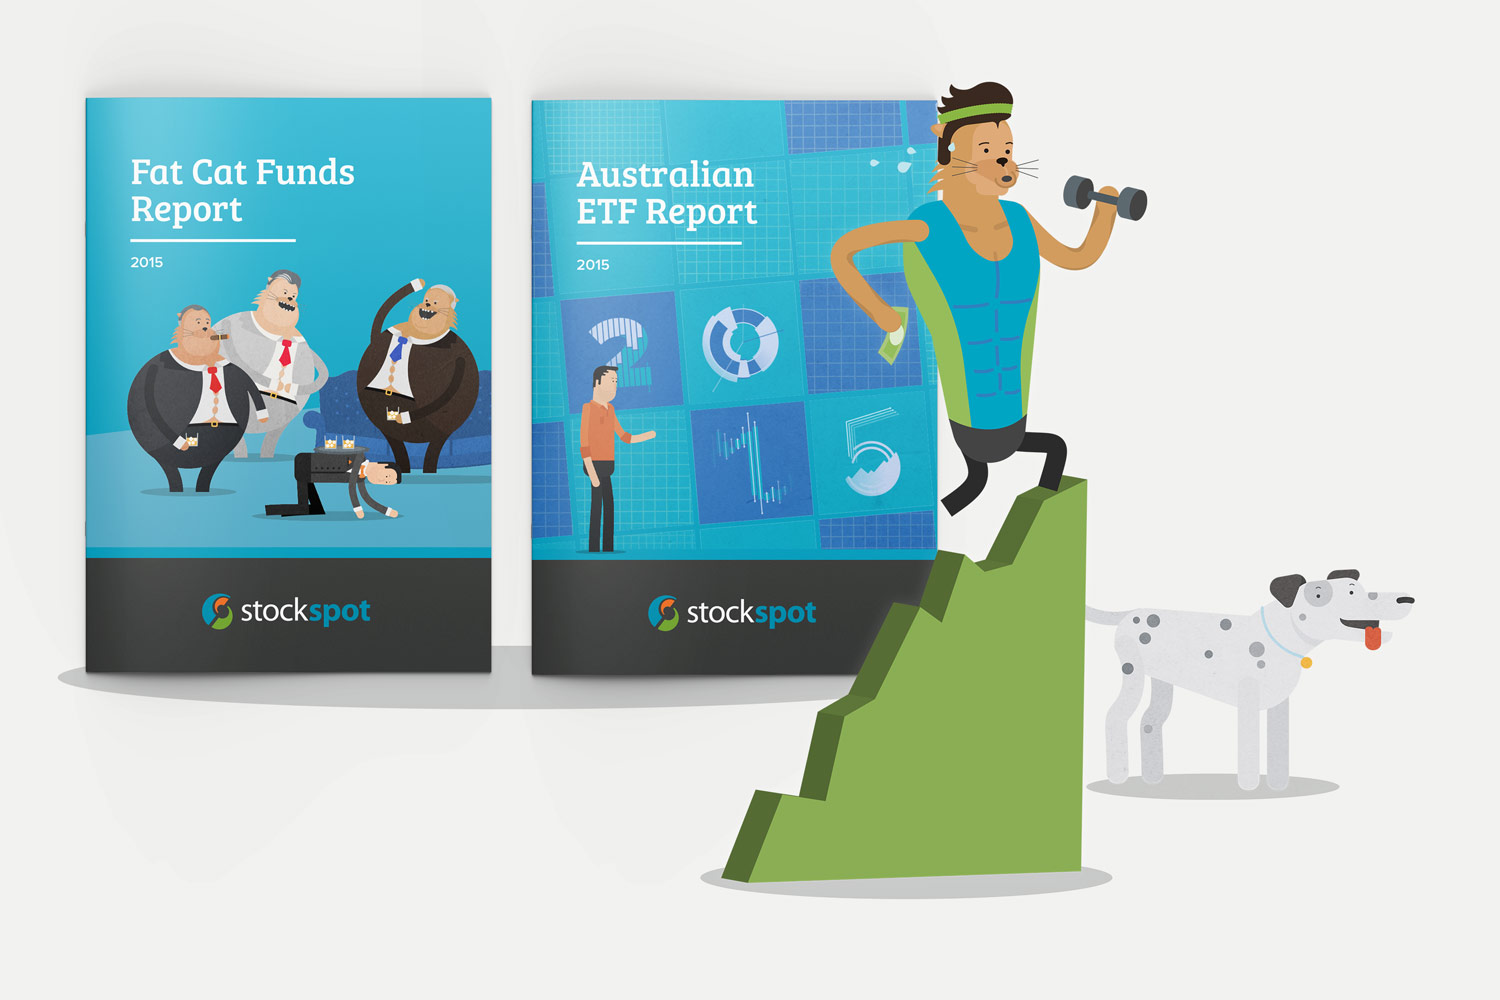
Designing for a fun, friendly Fintech company
My client is one of the new breed of Financial Technology (Fintech) companies, offering a vastly different approach to traditional wealth management institutions. This is exemplified in their product - which offers simplicity, low fees and unbiased advice. Since 2014 I have used my design skills to contribute to their marketing efforts - creating reports and illustrations which reflect their unique values and brand personality.
About the Project
Client:
An Australian Fintech company
Year:
2014-2015
Report Designs
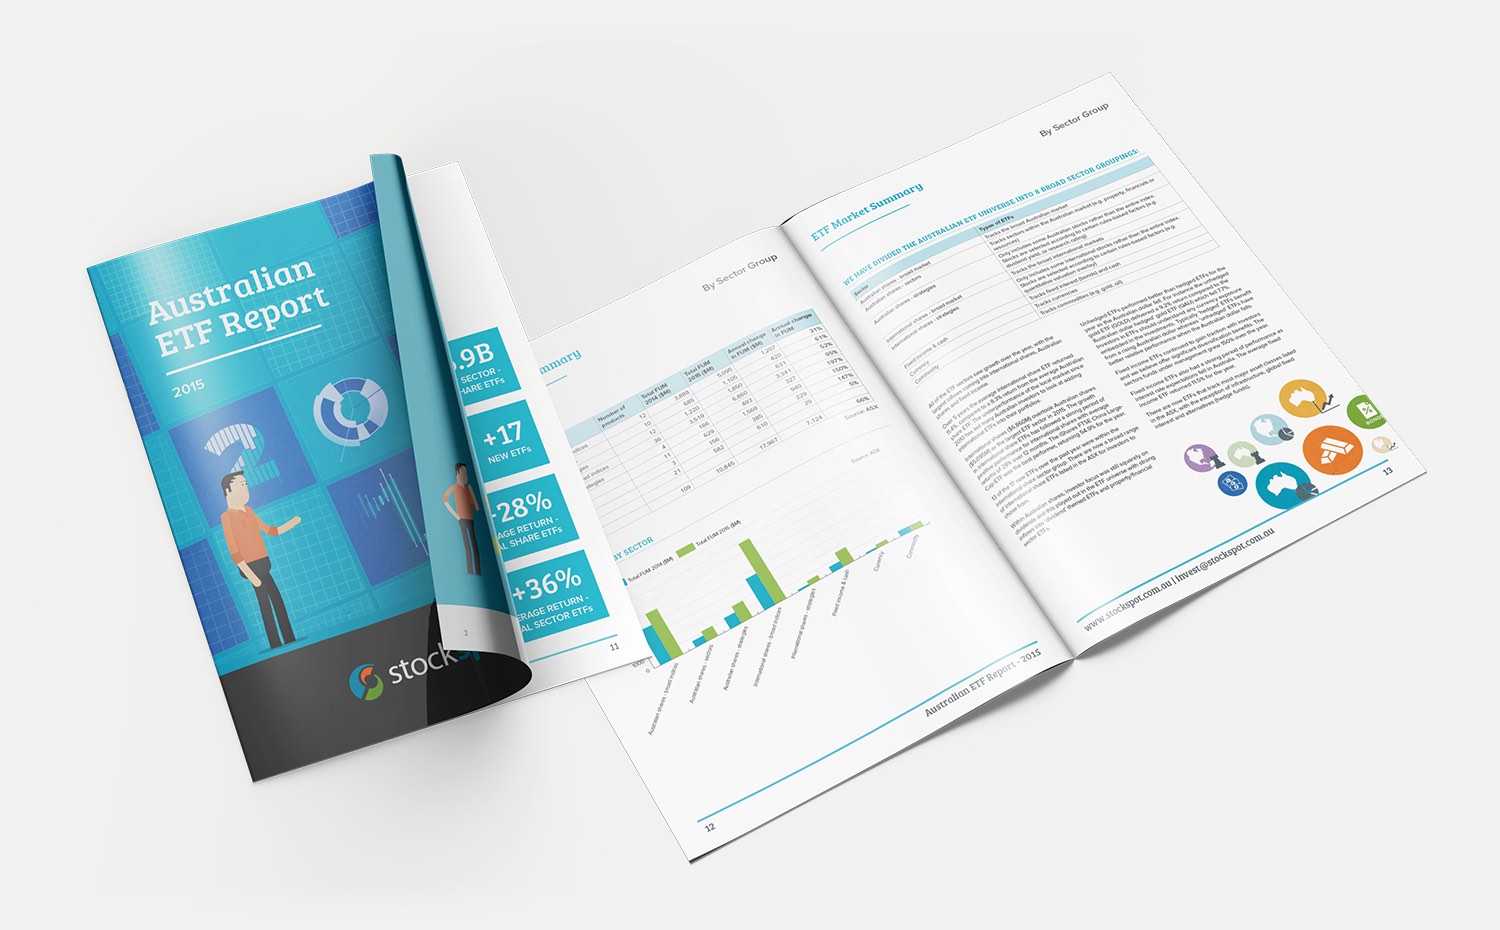
ETF Report
This report compares a huge list of investment products available in Australia. The layout has been designed to make the report easy to read and understand, and is enhanced with graphs and illustrations which further elaborate on the data provided.
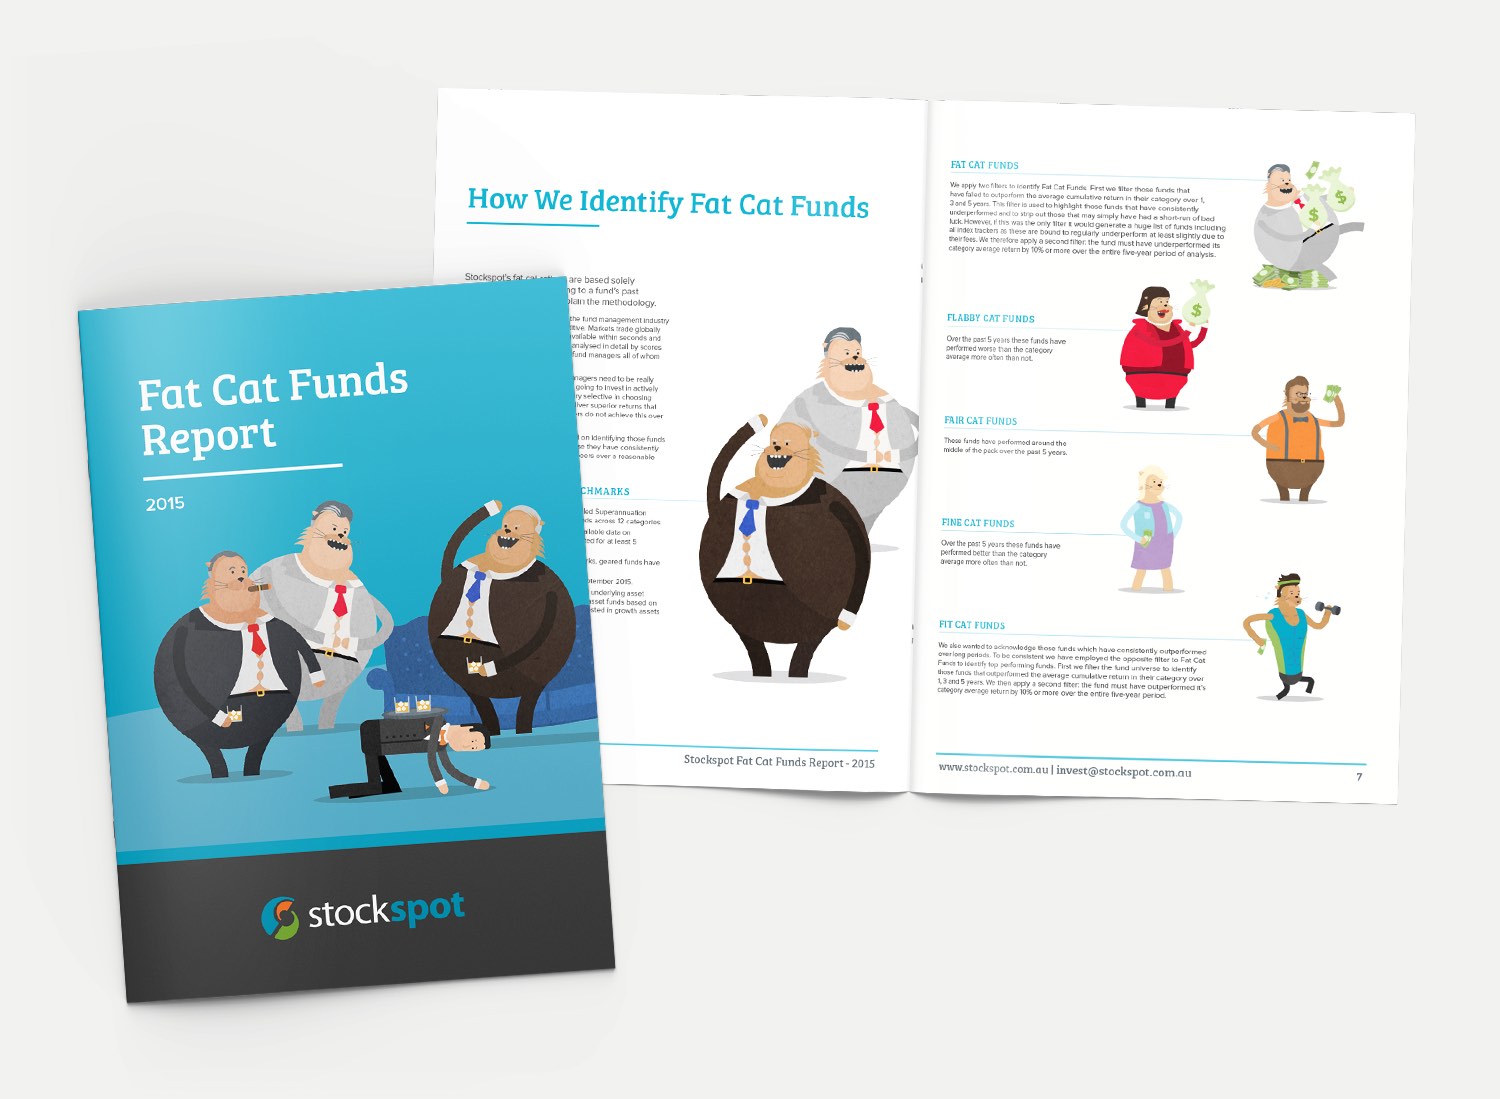
Industry Report
This report is a comparison of competing wealth management companies - calling out the best and worst performers in the market, and demonstrating the link between higher fees and poorer investment performance.
The report is designed for the everyday Australian investor, and humorously captures the greed of some of the worst performing companies with amusing illustrations dotted throughout the report (which were very fun to create!)
Illustrations & Visuals

Brand Illustrations
Over time I have created a vast collection of illustrations in the client's distinctive style. The illustration style conveys their distinct brand personality - where other financial institutions are dry and corporate, this company is bright, fun and friendly. Illustrations are used across the company’s materials - including reports, videos, email campaigns, advertisements and on social media.
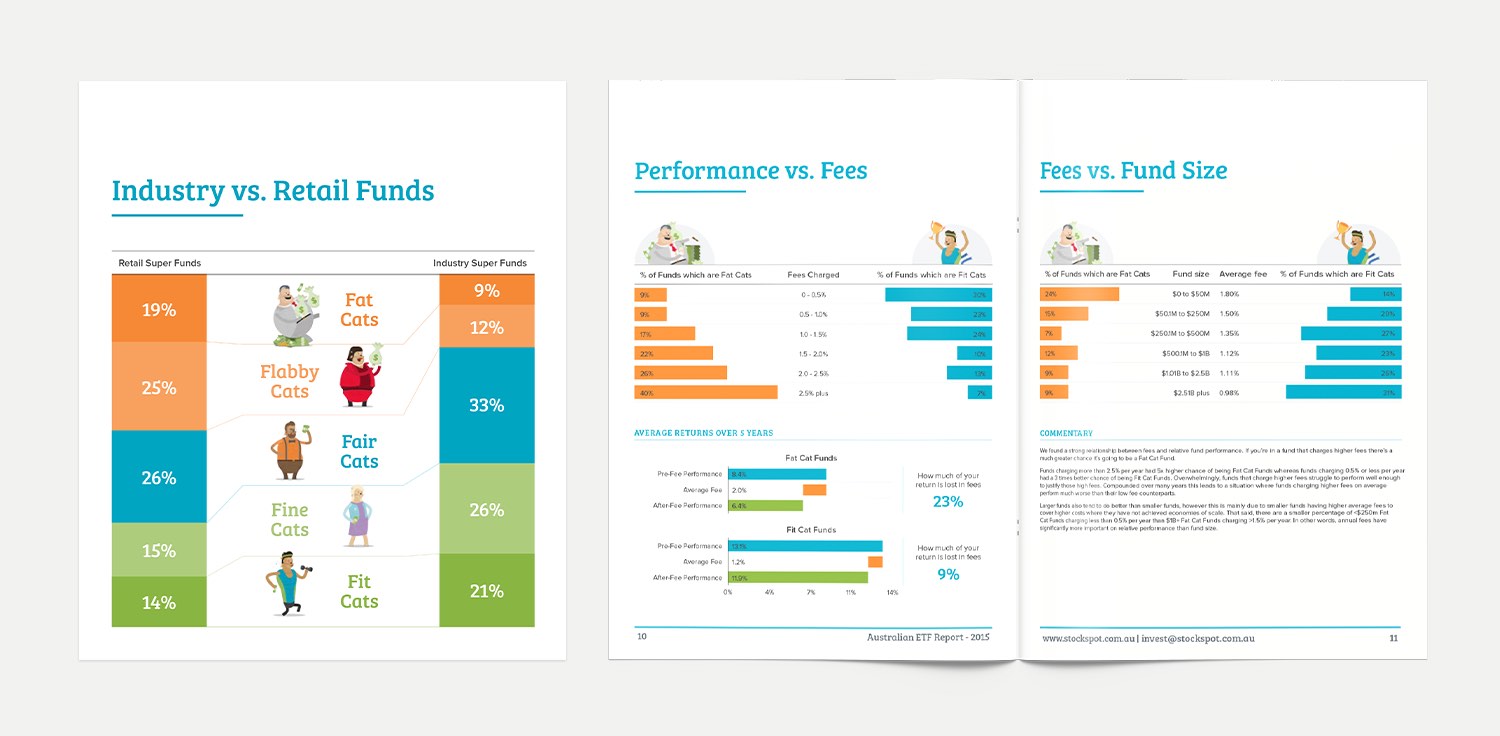
Infographics & Charts
Infographics and charts are extremely useful to help draw conclusions from large reams of financial data. Since they are used so frequently I developed a standard style for graphs which matches the overall brand. I have also created a number of infographics to visually explain key concepts.